
End the P&L
Your financials are lying to you and what to do about it.
Understand P&Ls • Explore Management Reports • Steal My Enhanced P&L
Read time: 15 min
The Intro
This is a free course. Originally, it was going to be a free email course. But, then I realized that I hate lead magnets. So, here it is, totally free, no email capture, no nothing. If you like what you read and want weekly business tips in your inbox, you can subscribe at the bottom of every page.
Okay, let’s get on with it.
Table of Contents
In this course, you’ll learn:
- Why reports are important
- Why P&Ls are so popular
- The problems with P&Ls
- Management reports 101
- My enhanced P&L
The goal of all this is to get your feet wet and introduce you to the world of business reports so you can better understand your business and make more educated decisions.
Lesson 1: why reports are important
If you’re like most people, the word ‘reports’ brings up bad memories. Book reports, report cards, TPS reports, annual reports, credit reports, expense reports. Ughhh, reports suck (and why is there always so much reading involved? I didn’t become an accountant to read.)!
What exactly is a report though? Wikipedia says:
a report is a document that presents information in an organized format for a specific audience and purpose.
Which is exactly what all those previous examples do. But, what if, (and stick with me here) we could create a document that presents information about your business in an easily digestible format for you and your senior managers. It would let you quickly look at your business’s important data and make decisions. That sounds pretty good, right?
Well, that’s the exact point behind business reports. Their goal is to help you quickly understand your business.
Common Business Reports
Profit & Loss:
A Profit & Loss report (sometimes called an Income Statement or P&L) give you a birds-eye view of your revenue, expenses, and profit over a chosen period of time.
Decisions you can make:
- Is my business profitable enough?
- Are any of my expenses too high compared to my revenue?
- Are any of my expenses out of wack?
Formula to remember: revenue – expenses = profit
Balance Sheet:
A Balance Sheet reports your assets, liabilities, and stockholder’s equity on a specific date.
Decisions you can make:
- Is my business too leveraged (aka too much debt)?
- Do I have enough money saved in the business?
Formula to remember: assets = liabilities + stockholder’s equity
Statement of Cash Flows:
A Statement of Cash Flows lays out your cash flow from operating, investing, and financing activities over a chosen time period.
Operating activities include all the cash flows from business operations. Investing activities include all the cash flows from the purchase/sale of assets and loans made to vendors or from customers. Financing activities include all the cash flows from investors or banks, including dividends paid to investors.
Accounts Receiveable:
An Accounts Receiveable Aging report (sometimes called an A/R Aging report) shows how much your customers owe you and how long the invoices have been outstanding. Typically, the invoices are broken into time-based buckets (eg, 1-30 days overdue, 31-60 days overdue, 61-90 days overdue, 90+ days overdue).
Decisions you can make:
- Which invoices should I chase first?
- Should I overhaul my invoicing process?
- Does my business have a collections problem?
Payroll:
A Payroll report lays out all your employees, how much you paid them, how much their benefits cost, and how much employer-side Social Security and Medicare tax you paid over a chosen period.
Decisions you can make:
- Are any employees committing payroll fraud?
- Should I shop my benefits around?
Lesson 2: why are P&Ls so popular?
Arguably, one of the most popular small business reports is the Profit and Loss report (sometimes called an Income Statement). It’s in every (good) accounting software, every business owner has heard of it, and business taxes, loans, and valuations are all based on it in one way or another.
But, why exactly is it so popular? Why not another report?
It comes down to a few factors:
1, It’s easy to understand
Revenue minus expenses equals profit. It’s accounting 101, a basic business concept, and the way money works.
It’s also the basis for the Profit and Loss report. And, since you’re already familiar with the concept, it makes Profit and Loss reports easy to understand.
2, It’s easy to digest
It’s simple. Revenue up top. Then categories of expenses down the page. You can quickly look at the Profit and Loss and get an understanding of how much revenue you generated and how many expenses you paid out.
3, It’s standardized
There are major accounting rules (think GAAP or IFRS, if you’ve ever heard of them) about how a Profit and Loss report works. If you put your data into 5 different accounting softwares, the Profit and Loss will always remain the same.
(In case you’re curious, GAAP stands for Generally Accepted Accounting Principles and IFRS stands for International Financial Reporting Standards. These two standards law out the accounting rules.)
4, It’s easy to produce
Log into your accounting software, navigate to reports, select Profit and Loss, choose some basic settings (if you don’t know what to choose, start with ‘Cash basis’ and a year long reporting period), then bam, your Profit and Loss report is ready to review!
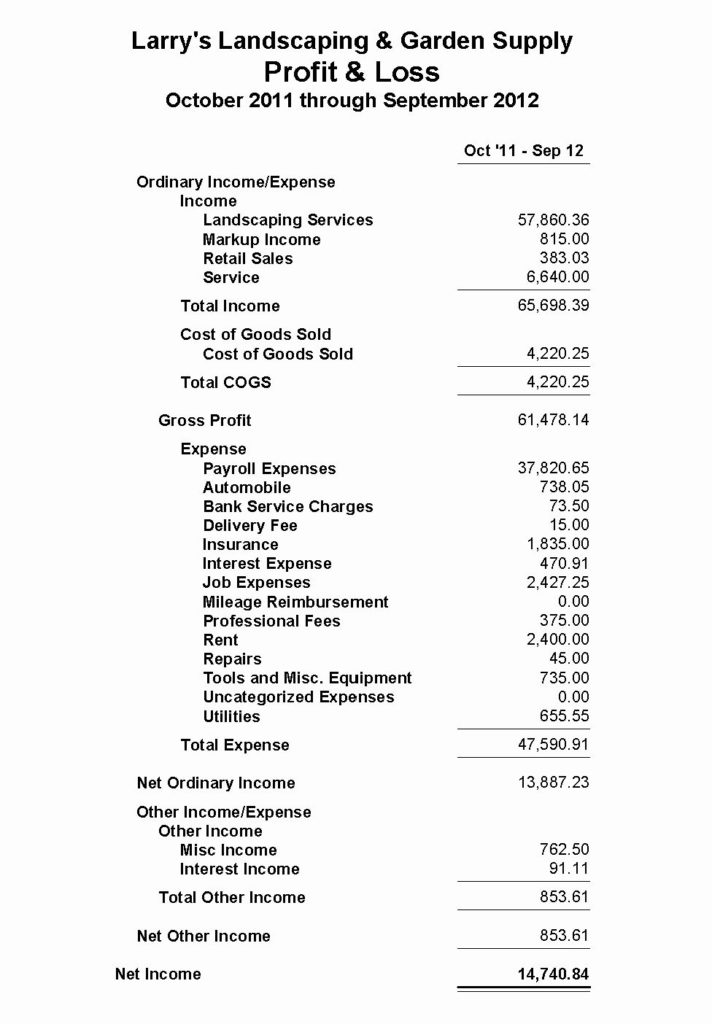
Psst… never seen a P&L before? That’s okay. Click below to see an example.
Your Title Goes Here
Your content goes here. Edit or remove this text inline or in the module Content settings. You can also style every aspect of this content in the module Design settings and even apply custom CSS to this text in the module Advanced settings.
Profit & Loss Example
Lesson 3: the problems with P&Ls
I don’t like P&Ls. There I said it. Call the accounting police on me. 🚨🚨
They’re easy to digest, convenient, and a decent basic report. And, that’s where the good things end. P&Ls can also incredibly misleading reports that, if misunderstood, can lead you to making poor decisions based on a bad understanding of your business.
The accounting rules that make P&Ls so popular are a double-edged sword. They dictate what makes up a P&L. And, that’s good for standardization across the accounting industry. But, that’s also bad for business owners that don’t understand the underlying accounting rules.
1, only includes revenue and expense accounts
P&Ls are only supposed to include revenue and expense accounts. They don’t include asset, liability, or stockholder’s equity accounts.
Now, you’re a smart reader and remember from my last email that asset, liability, and stockholder’s equity accounts appear on the Balance Sheet! You’re right (and did I mention very astute?)! The problem lies in specific accounts that act similarly to revenue and expenses. There are two in particular: distributions and loan payments.
In accounting, distributions and loan payments aren’t considered expenses and aren’t included in your P&L. But,any business owner could tell you that these are common business outflows. Some might even argue that they reduce your profit (but accounting would disagree).
2, depreciation is a phantom expense
Then, on the other side of the coin, you have an expense which doesn’t really exist: depreciation expense. Simply put, depreciation expense is deducting a large expense over a number of years instead of all at once. Depreciation is a standard concept in GAAP, IFRS, and US tax accounting.
But, when you buy a large capital item (major renovations, equipment, vehicles, etc), you buy it all at once with cash or a loan. You don’t buy it in small chunks over a few years. For many small business owners, it would make more sense to recognize the expense all at once when they make the purchase instead of taking a little depreciation expense every month.
3, taxes aren’t always a business expense
P&Ls are only supposed to include BUSINESS revenue and expense accounts. Most small businesses take advantage of pass-through entities to avoid double taxation. That means the business’s profit is passed from the entity (where it isn’t taxed) to your personal tax return (where it is taxed). That makes the taxes stemming from your business profit a PERSONAL expense.
S-corps, LLCs, and partnerships all suffer from this technicality. A properly prepared P&L for any of those entities will not show any income tax. But, we all know personal income taxes are a huge expense for small, 1-5 owner businesses.
4, it’s built on data
Lastly, a P&L is only as good as the data it’s built on. If you’re miscategorizing your expenses, it’s going to show on your P&L. (quick aside: I once had a client miscategorize $60,000 worth of expenses off his P&L and onto his Balance Sheet. Whoops!) If you only link your bank accounts to your accounting software and don’t include your credit cards, it’s going to show on your P&L. If you have duplicate transactions, it’s going to show on your P&L. Any mistakes in your data will show on your P&L.
And, let’s call it what it is, if you’re half-assing your bookkeeping, you’re going to get a half-assed P&L. You can’t make decisions with a half-assed P&L.
4a, depreciation is built on your fixed asset manager
A fixed asset manager tracks your major depreciation-worthy capital purchases. The info from the fixed asset manager is used to calculate your depreciation expense. And, I can’t remember the last set of books that included a correct fixed asset manager.
If you aren’t using the fixed asset manager properly, your P&Ls probably have misstated or incorrect depreciation expense. (Although, I can’t fault you for this one because depreciation is a deceptively complicated accounting concept)
Lesson 4: management reports 101
In Lesson 1, I talked about creating a document that presents info about your business in an easily digestible format so you could quickly look at your important data and make decisions.
Then, in Lessons 2 and 3, I explained the pros and cons of standard accounting reports, specifically the P&L. And, why they aren’t a good fit for many small business owners.
Enter the management report.
Management reports aren’t bound by accounting rules. They can be anything you want them to be and can track countless KPIs (key performance indicators).
There are two main types of small business management reports: 1) those based on standard accounting reports (hint hint, I’ll talk about this in the next email), and 2) those started from scratch
1, based on accounting reports
I’m a huge fan of tailoring standard accounting reports to your specific business’s needs. You can take a P&L, add the detail you want to see (maybe revenue should be broken up by product or you’d like to see very detailed expense info), and then make adjustments for the intrinsic accounting issues found in a P&L.
You can usually set up a custom accounting-based management report in your accounting software. That way you’ll be able to quickly generate your management report based on the accounting data you’re already tracking.
2, building from scratch
You can also build management reports from scratch. These are great for tracking non-accounting KPIs like hours spent on projects, sales calls and closes, appointments scheduled, or number of project change orders.
These management reports will usually require a non-accounting software to generate. Sales based management reports can be generated by your CRM (aka, a Customer Relationship Manager. If you don’t already have a CRM, consider getting one). Project and hours based management reports can be generated by your project management software.
Depending on how intensive your non-accounting management reports are you may even need a reporting dashboard that can pull together information from multiple sources into one dashboard. One example of this is Fathom (fathomhq.com), another (to a lesser extent) is Dryrun (dryrun.com).
Management reports are incredibly underutilized by small business owners. Think about what metrics you want to track and consider making your own unique management report.
Lesson 5: my fav management report:
the enhanced P&L
In the last lesson, I briefly touched on a P&L-based management report. Get access to my Enhanced P&L template here (and receive additional business tips in your inbox every Saturday)!
Open it, review it, compare my explanations to the template, then steal it and use it in your business. (Seriously, steal it. I’m giving you my permission.)
My improvements 😉
1, more detailed revenue info
I didn’t mention this in Lesson 3 because it isn’t necessarily a problem with P&L, but I dislike how vague the revenue info is compared to how detailed the expense info is. Even the most basic businesses have multiple services, products, or revenue streams and you should, at a glance, know how much each revenue stream is bringing in.
2, deducting direct costs and client reimbursables up top
Not all expenses are created equal. Some are directly tied to providing a product or service and others are overhead. In my enhanced P&L, I deduct direct expenses and other reimbursables directly from their revenue streams.
My two main direct expenses are: 1, direct labor which includes freelancers, contractors, and any outsourced work, 2, direct cost which includes software/tools bought specifically for a client project, expenses billed directly to your client, and similar expenses.
3, bucketing expense info
On a standard P&L, the expenses are all bucketed into one category: expenses. Not exactly descriptive, right?
In my enhanced P&L, I bucket expenses into 5 sub-buckets. These buckets allow you to quickly get a general idea of how much the important sectors of your business are costing you, but also allows you to drill down into the detail you need.
- Location so you can quickly understand how much maintaining a physical location costs.
- Payroll which includes billable employees, admin employees, payroll tax, and benefits so you can quickly understand your true payroll cost. I break employees into billable and administrative so you can easily see how much they each cost you.
- Marketing so you can quickly see how much your various marketing efforts cost. (You do spend money on marketing, right?)
- Other operating which is basically all your other overhead that is required to run a business like software, legal & professional fees, insurance, etc
- Non-operating which is just interest paid and depreciation (if you choose to keep it on your P&L)
4, adding non-P&L accounts to the P&L
This part is an accounting sin and why I call this a management report instead of an accounting report. I add non-P&L cash flow accounts to my P&L. There’s three in particular that deserve a place on your P&L-based report: shareholder distributions (broken up by shareholder), loan payments (minus interest), and shareholder taxes.
The data for shareholder distributions and loan payments is already in your accounting software. The info for taxes takes a bit of funny business and may require exporting your info to Excel or Google Sheets. I suggest using a super basic tax calculation to arrive at your shareholder taxes number. Ask your tax accountant what your effective tax rate was (tax divided by total income) then multiply that by your business profit. This number won’t be close to correct, year-end tax liability and shouldn’t be relied on too heavily. But, it will be close enough for decision making purposes.
Steal my Enhanced P&L and join Ordinary & Necessary:
1, My enhanced P&L with all my improvements. Free for you to steal and use.
2, Business tips in your inbox every Saturday. No charge. No spam. Unsubscribe anytime.